X-ray tomography or CT scanning is a form of non-destructive 3D scanning or testing (NDT). It allows you to capture the complete outside surface, but also the internal structure of an object without the need to destroy it.
We frequently use this technique in our measurement services, for example, in the quality inspection of plastics. However, 3D-printed metal objects, assemblies, and many other items can also be inspected in this way.
Since most of the objects we scan for our clients are covered by a non-disclosure agreement (NDA), we have chosen a children’s toy car, made up of various plastic parts, to demonstrate the full CT scanning process.
With the scan data from this object, we can illustrate some principles and delve deeper into the various results of industrial CT scans.
Check out our case study of the CT scan of a plastic toy car to explore more results from this scan.
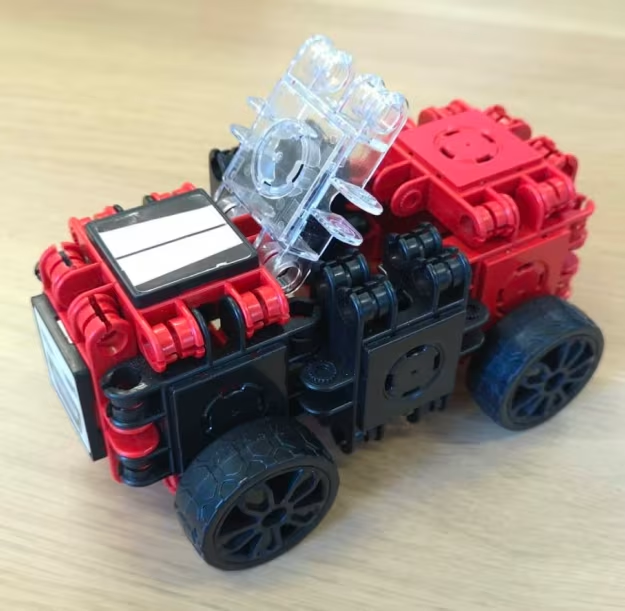
The toy car consists of various plastic blocks that click together. This makes it a rather complex assembly, and there is much to uncover through CT scanning.
Typical inspections include:
- Deformations of the individual components compared to the assembled versions.
- Dimensions of both the individual elements and the complete assembly.
- Porosity or inclusions in the material
- Fittings and gaps (or seals) between different components
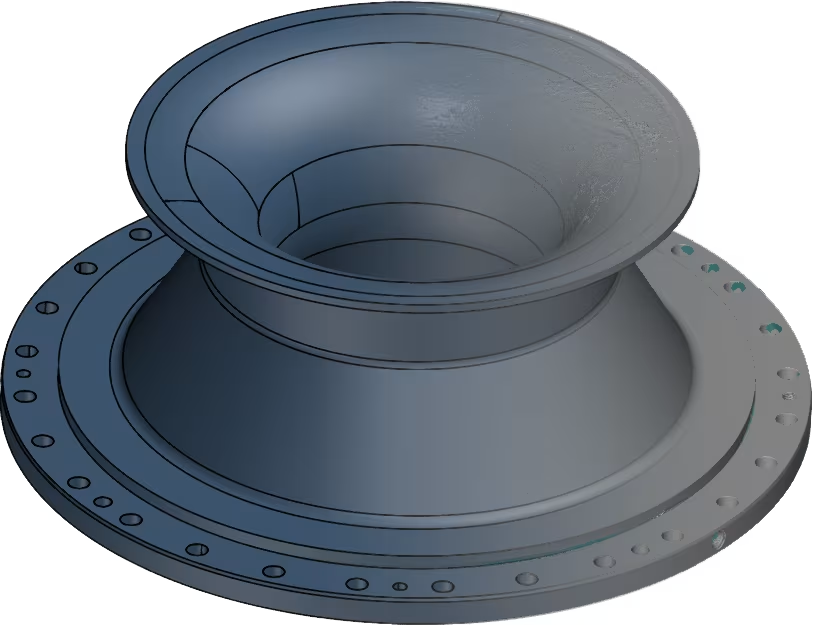
A CT scan also provides a highly comprehensive and extremely detailed watertight dataset.
With a more traditional optical scanner, it would be impossible to capture the full shape due to line-of-sight limitations. This would result in an incomplete scan with gaps, and it would take time to make it watertight for further processing, such as 3D printing.

The X-ray CT scanning process
The complete X-ray CT scanning process consists of three distinct steps:
- Collecting the X-ray images
- 3D CT volume reconstruction
- Polygonisation or extraction of the surface data

Collecting the X-ray images
X-ray images are a well-known technique from the medical field. If you have a broken arm, you go to the hospital, and they take an X-ray to see where and how your bone is fractured. The result is a typical black-and-white image, where denser materials (like your bone structure) appear white, and the surrounding air, for example, appears black.
In fact, not only density plays a role, but also the attenuation coefficient of a material.
This tells you how much the intensity of the X-ray beam is reduced as it travels through a given material. This value is closely related to the density of that material.
Moreover, more X-rays are absorbed when more material is penetrated compared to less material with the same attenuation, meaning that this area will appear whiter on the image.
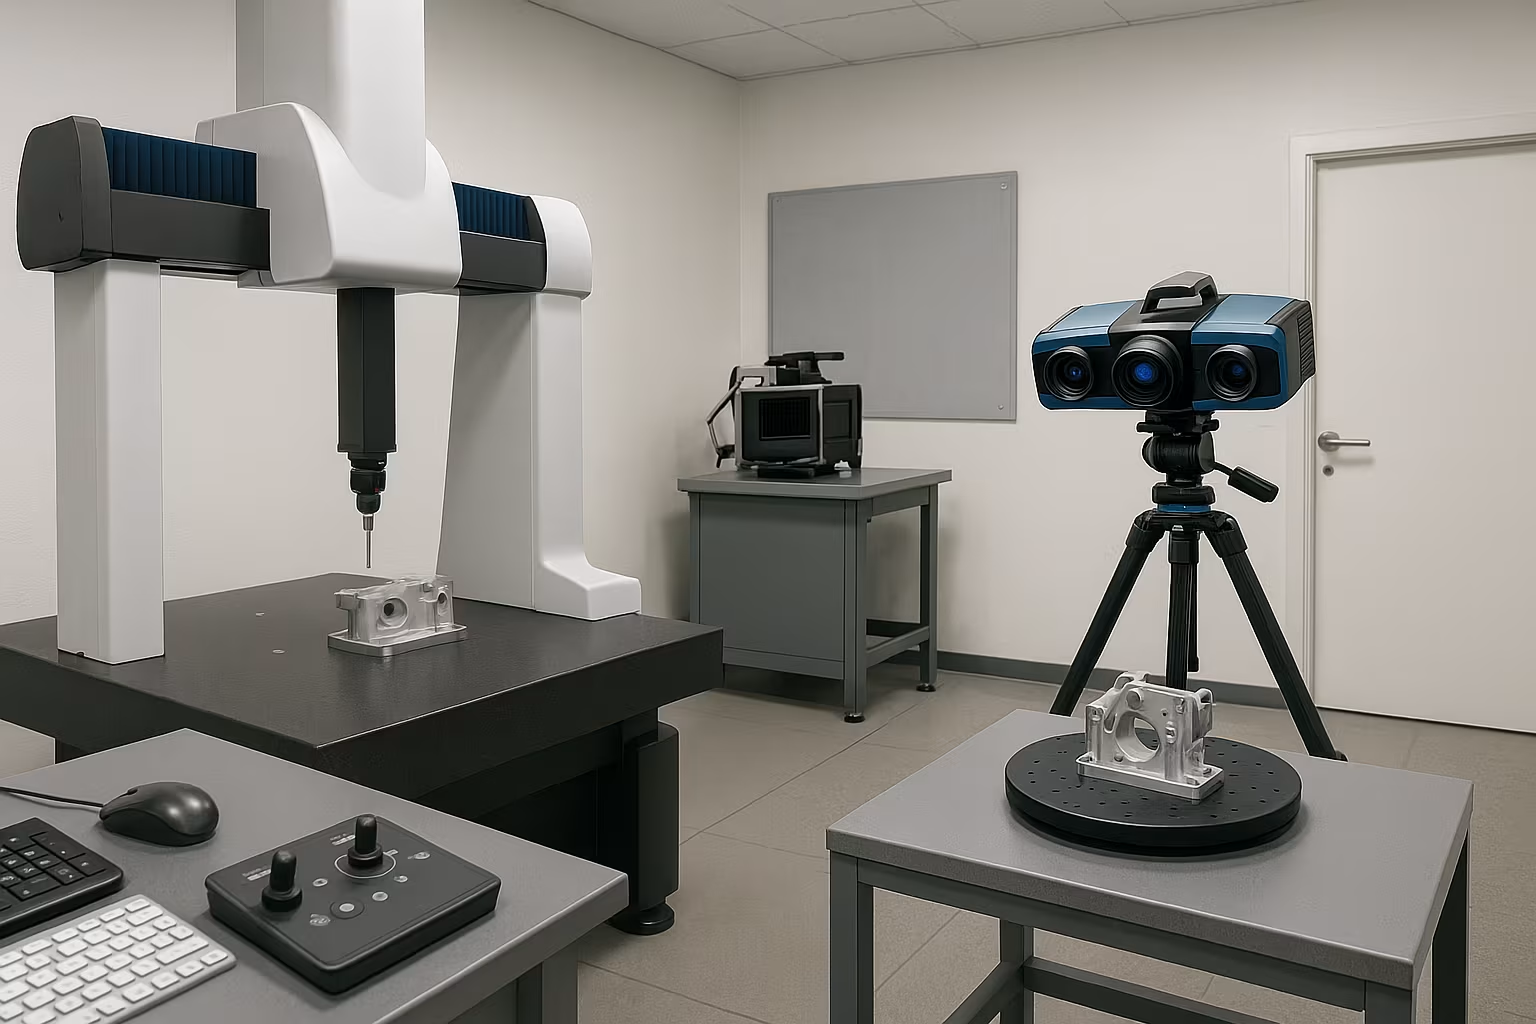
In a CT scanner you have an X-ray source, a rotation table and a detector.
The X-ray source produces a cone beam of X-rays which fall onto the detector.
In between these two components you have a rotation table.
The object that needs to be scanned is placed on this rotation table.
When you start a scan, the system will take a first X-ray image and then rotate the object a little bit using the rotation table before taking the next image.
Usually there are somewhere between 1.000 and 3.000 X-ray images taken over a full rotation of 360 degrees.

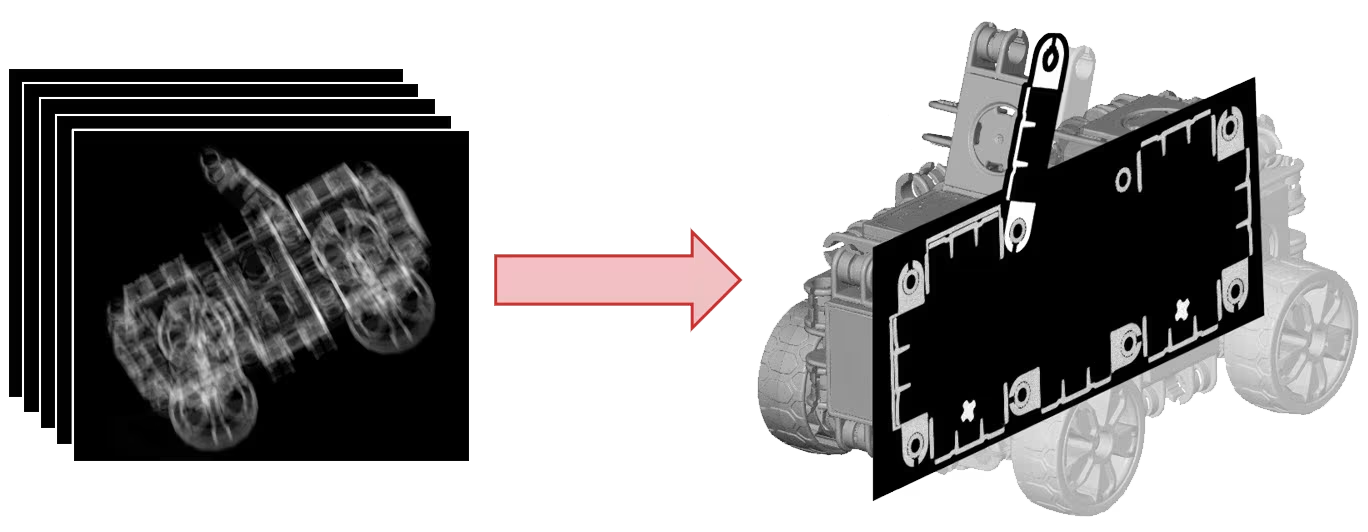
3D CT volume reconstruction
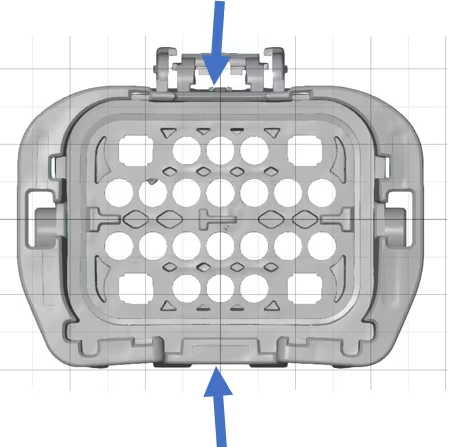
The drawback of an X-ray image is that the geometry of the complete object is mapped on this 2D image. Features that are on the back of the object will overlap with features that are on the front. This makes it sometimes difficult to interpret a single X-ray image and therefor it’s also not very useful for metrology purposes.
When reconstructing a 3D CT volume the computer will go from a bundle of flat 2D images to one complete 3D volume.
This 3D volume is like a big box filled with tiny cubes. Each cube is called a voxel and has a certain size (the voxel size or resolution of the CT scan). Each voxel has a certain grayscale color that corresponds to the attenuation coefficient of that specific piece of material.
Whatever is in the 3D volume can be rendered in 3D, but you can also slice the volume virtually and have a look at a 2D representation of this slice.

Polygonisation or extraction of the surface data
In the last step of the process we go from a 3D volume of voxels to a surface of triangles or a mesh.
To do this the software looks for the different materials in a CT scan and calculates the border between them. In the image below you can see a black (air) and a white (plastic) region. There is also a certain gradient when going from black to white. Wherever this gradient is the steepest, that’s the spot where the surface lies. This is visualized with a red line in the screenshot. This red line is calculated at a sub-voxel level, so accuracy wise you are not bound to the resolution of a scan, but you can determine the surface approximately 10X as accurate.

The result is a watertight, highly detailed, 3D surface mesh.