With the rise of metal 3D printing technology, the need for accurate quality control has become essential—especially in applications where structural integrity is critical.
Computed tomography (CT), or X-ray CT scanning, offers a powerful method for visualizing the internal structures of printed objects in high resolution. In this case study, we demonstrate how deep learning is used to automatically analyze CT scans of metal 3D-printed components, with the goal of identifying and mapping porosities.
The product: a 3D printed manifold
The product we scanned is a 3D-printed manifold intended for applications in the semiconductor industry. This manifold is made from a titanium-based alloy and has a nominal wall thickness of only 0.5 mm. The combination of the material and the thin wall structure makes it a challenging object to inspect accurately, especially when it comes to detecting internal porosities.


Result of the CT scan
Since the product specifications require the detection of porosities of 0.1 mm or larger, we generally scan this component at a resolution of approximately 30 µm (voxel size). Below is a CT slice showing several visible porosities, as well as a denser particle or inclusion.

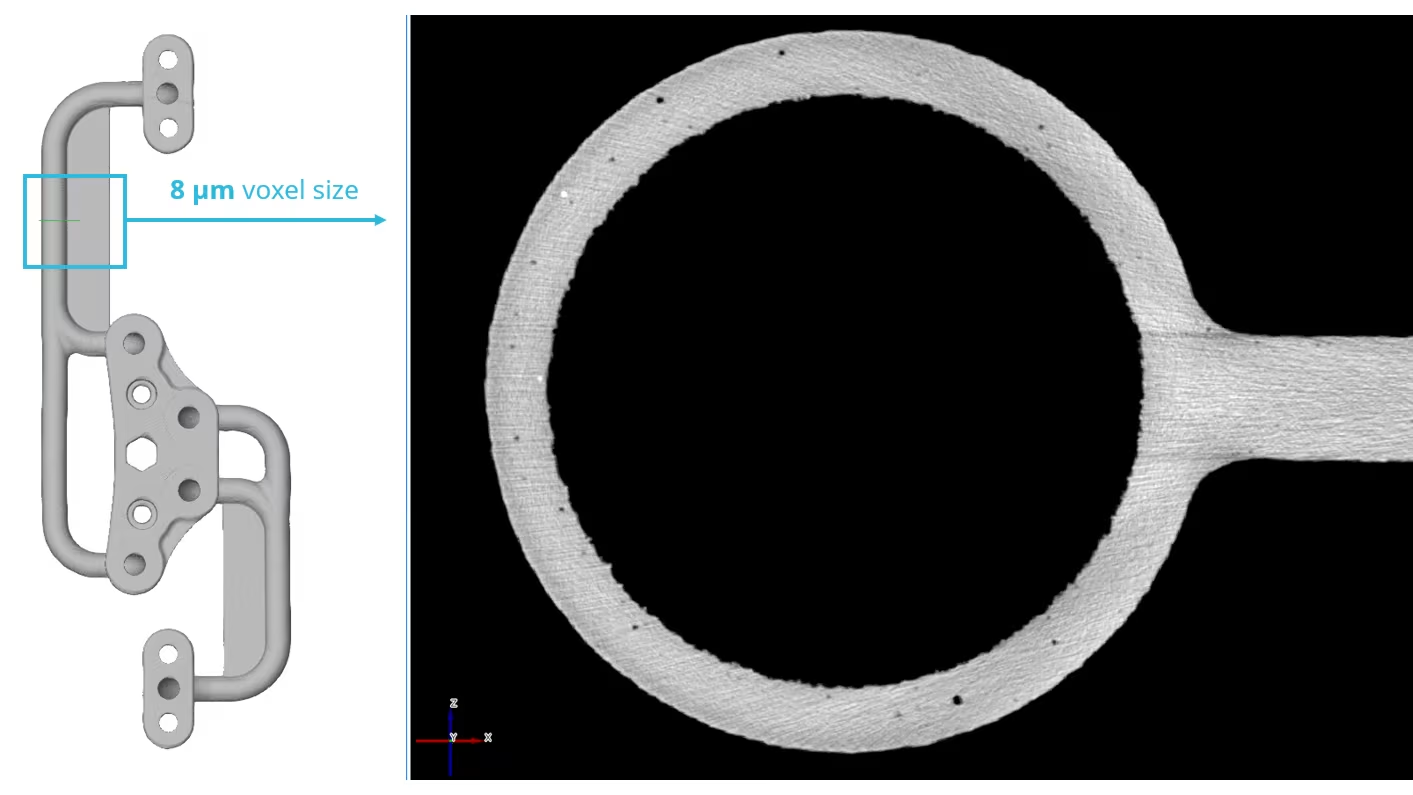
Especially in the initial phase of a deep learning project, we prefer to make a high-resolution scan of a limited area. This helps to gain a clear and detailed understanding of the nature and shape of the present defects. This is well illustrated in the following CT slice: the porosities are shown with greater clarity, and additionally, a second inclusion becomes visible that previously went unnoticed.
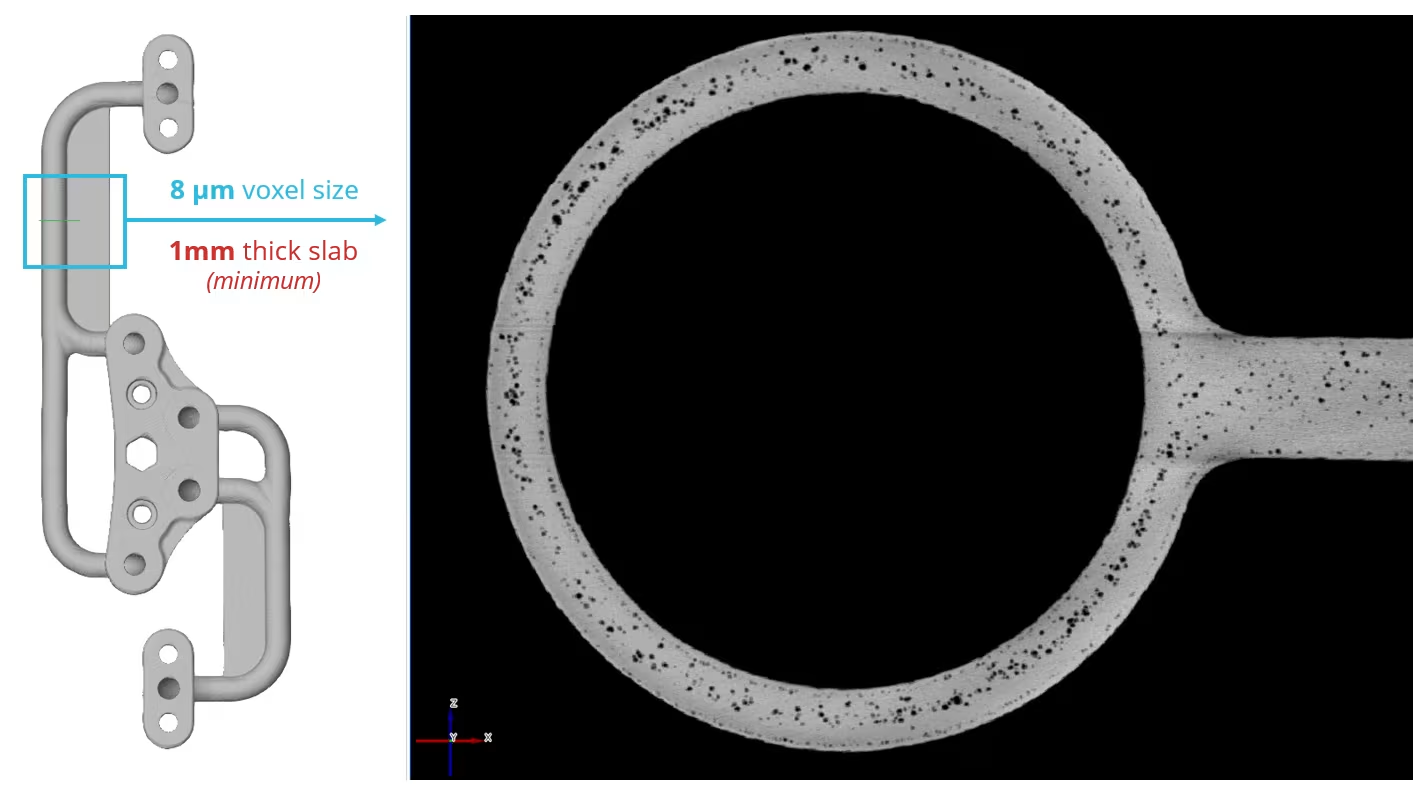
When we not just analyze a single slice at the same resolution of 8 µm, but instead perform a so-called minimum intensity projection over a 1 mm thick region, the following image is produced. In this visualization, all minimum voxel values within that depth are displayed, making porosities in this zone clearly stand out. Notably, the denser inclusions are not visible in this image, as this technique specifically focuses on highlighting the lowest densities — typically associated with porosities.
The same approach can, of course, be applied using a maximum intensity projection to visualize all inclusions within this zone.
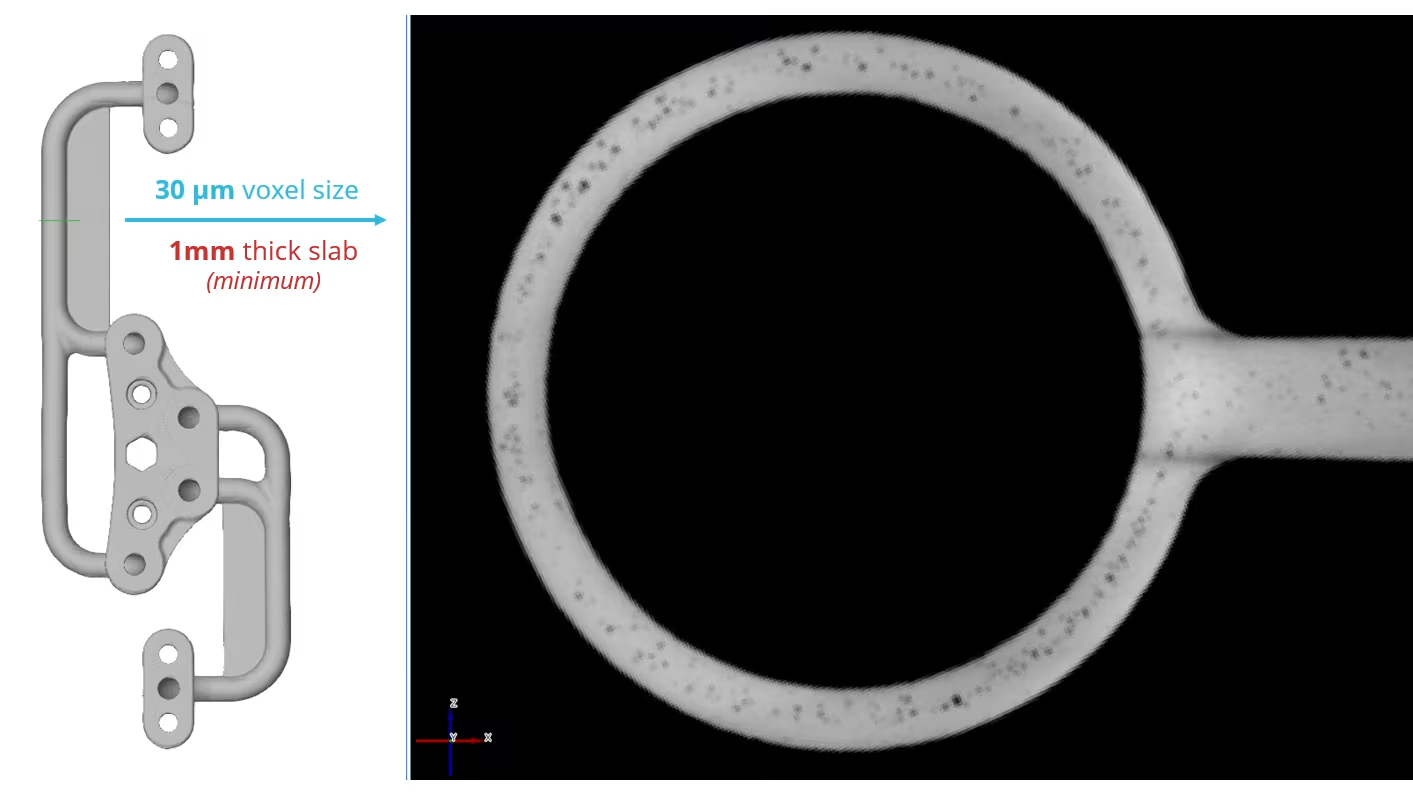
In this image, it is clearly visible that the larger porosities are primarily located in the center of the material. Around the outer contour of the product, a finer structure of very small porosities appears, forming a sort of trail that follows the edge. This is most likely related to the printing process and how the laser builds up the different layers.
That same minimum intensity projection over a 1 mm zone appears as follows on the original 30 µm scan.
Traditional methods of inspection
Manual inspection
A commonly used traditional approach is the manual review of CT slices, where the operator visually searches for defects and marks them as they are observed. This method heavily relies on the operator’s experience and attention, and can also be time-consuming and error-prone — especially with large datasets or subtle porosities.
In the case of this manifold, which has a length of 166 mm, a scan resolution of 30 µm results in no less than 5,533 slice images being generated. Manually reviewing all of these images to detect defects is extremely time-consuming. Moreover, these are only cross-sections in the horizontal z-plane. Since some porosities are elongated and spread through the material in complex shapes, it would ideally be necessary to also inspect in other directions (such as along the x and y axes) to obtain a complete and accurate view. This makes manual inspection even more labor-intensive and increases the risk of missed defects.


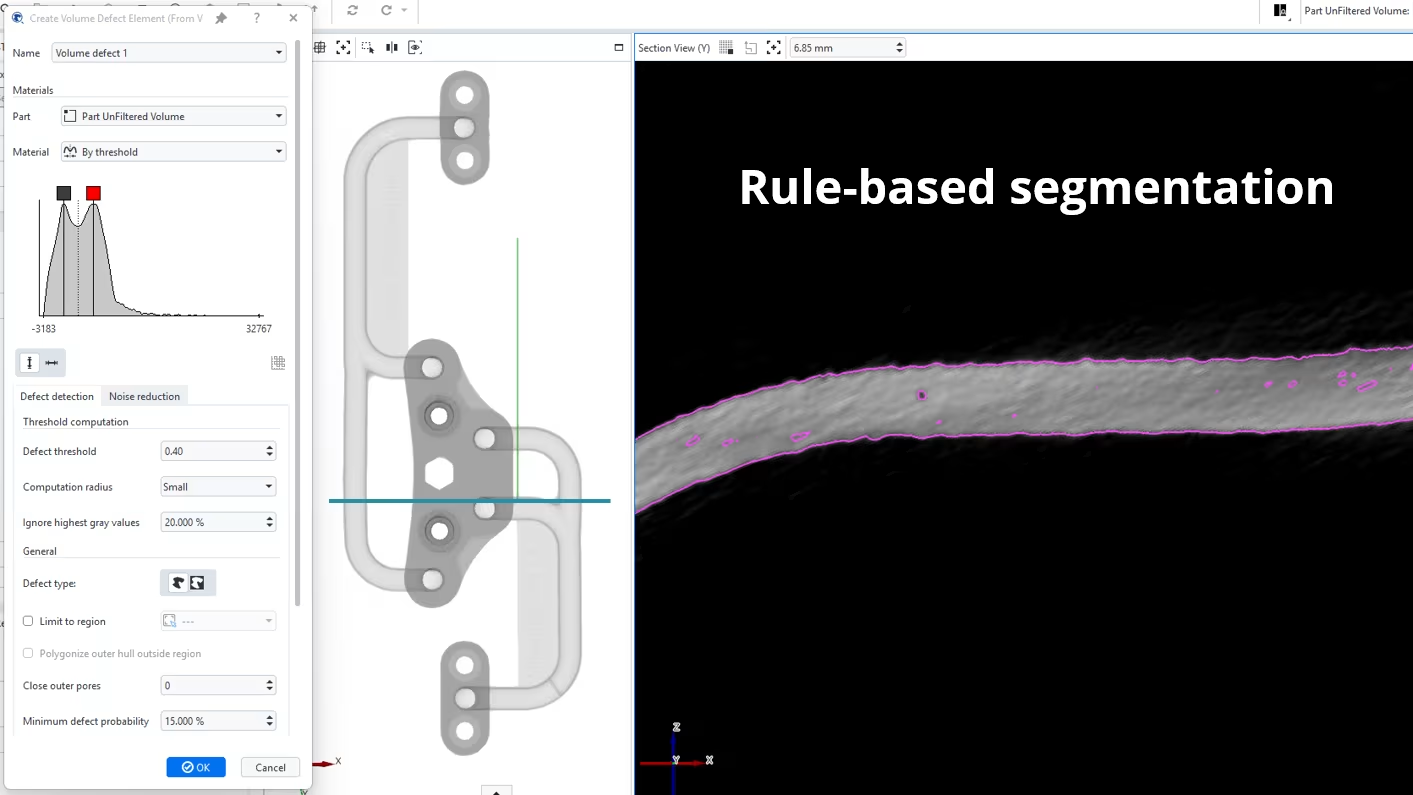
Rule-based segmentation
For the automatic detection of porosities in CT data, rule-based segmentation has traditionally been used. This approach applies fixed threshold values and logical rules, such as intensity limits (grayscale), shape criteria, or volume thresholds, to distinguish pores from the base material. While this method can work reasonably well in simple cases, it is sensitive to noise, variations in material density, and scan artifacts. Additionally, tuning the correct parameters often requires a lot of manual effort, and the results are highly dependent on the chosen settings. In complex or fine-grained structures, such as 3D-printed components, this approach often falls short compared to deep learning methods.
Deep learning
Deep learning is essentially a form of automated pattern recognition — something we, as humans, are naturally good at as well. When scrolling through a CT scan, an operator can often intuitively and quickly identify what is a porosity and what is not. The major difference, however, lies in the amount of information a deep learning model can process. While we as humans are limited to interpreting images as they appear on a screen — typically in 8-bit resolution with a maximum of 256 shades of gray — a deep learning model works directly on the raw 16-bit data from the scan. That translates to no less than 65.536 different gray values. For comparison, the average person can distinguish only about 60 shades of gray. Thanks to this higher level of information, a model can detect subtle differences that remain invisible to the human eye, resulting in a more accurate and objective analysis.
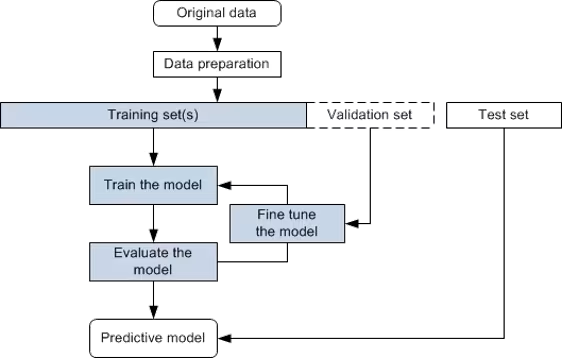
The first step in the process is creating a suitable training dataset. To do this, we select small subvolumes from well-chosen areas within the scan. While this can be done with a single scan, it is recommended to use data from multiple scans or products to improve the model’s robustness. The next step is annotation: accurately labeling porosity regions, either manually or semi-automatically. This step is crucial — the accuracy of the ground truth data largely determines the quality of the final model.
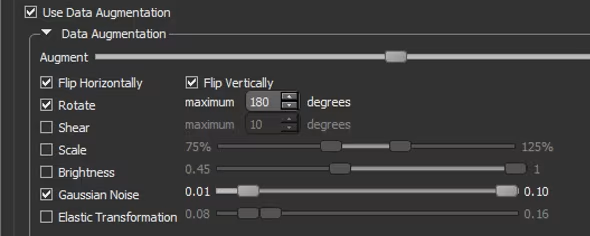
To further enrich the dataset and help the model generalize, we apply data augmentation. This is followed by the usual steps in the machine learning pipeline: training, evaluation, and iterative improvement. Finally, cross-validation is essential to avoid overfitting and to assess the model’s generalizability. In particular, it is important to closely monitor the results on the initial scans to detect and correct any errors at an early stage.
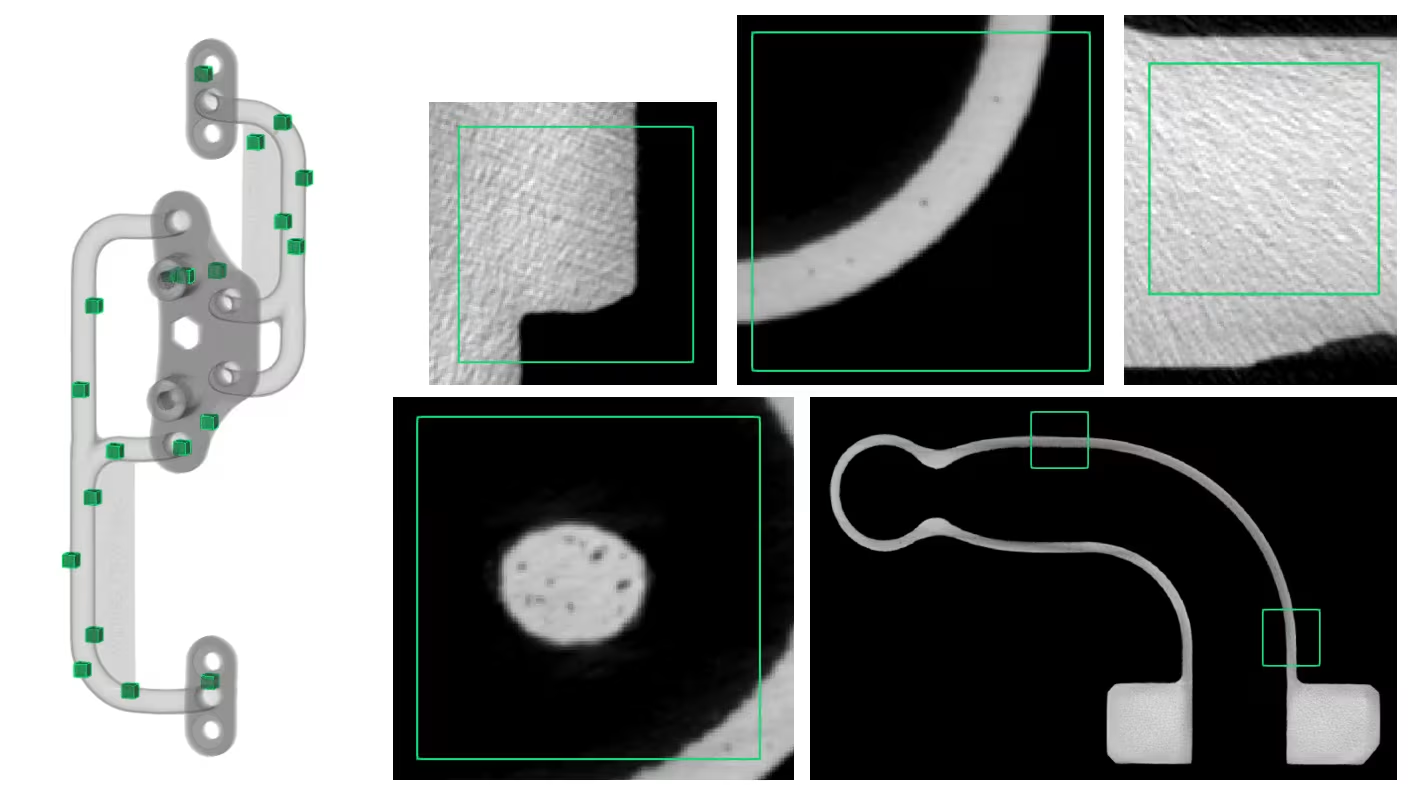
Training dataset
A typical training dataset, built from a single product, looks like the one shown in the image. Multiple subvolumes are selected from different zones of the component. When constructing this dataset, we aim for as much variation as possible: regions with clearly visible porosities, as well as zones that contain only noise or are completely defect-free. Including such “negative examples” is crucial, as it teaches the deep learning model to distinguish between real defects and harmless artifacts or image noise. This balanced approach significantly improves the model’s accuracy and reliability.
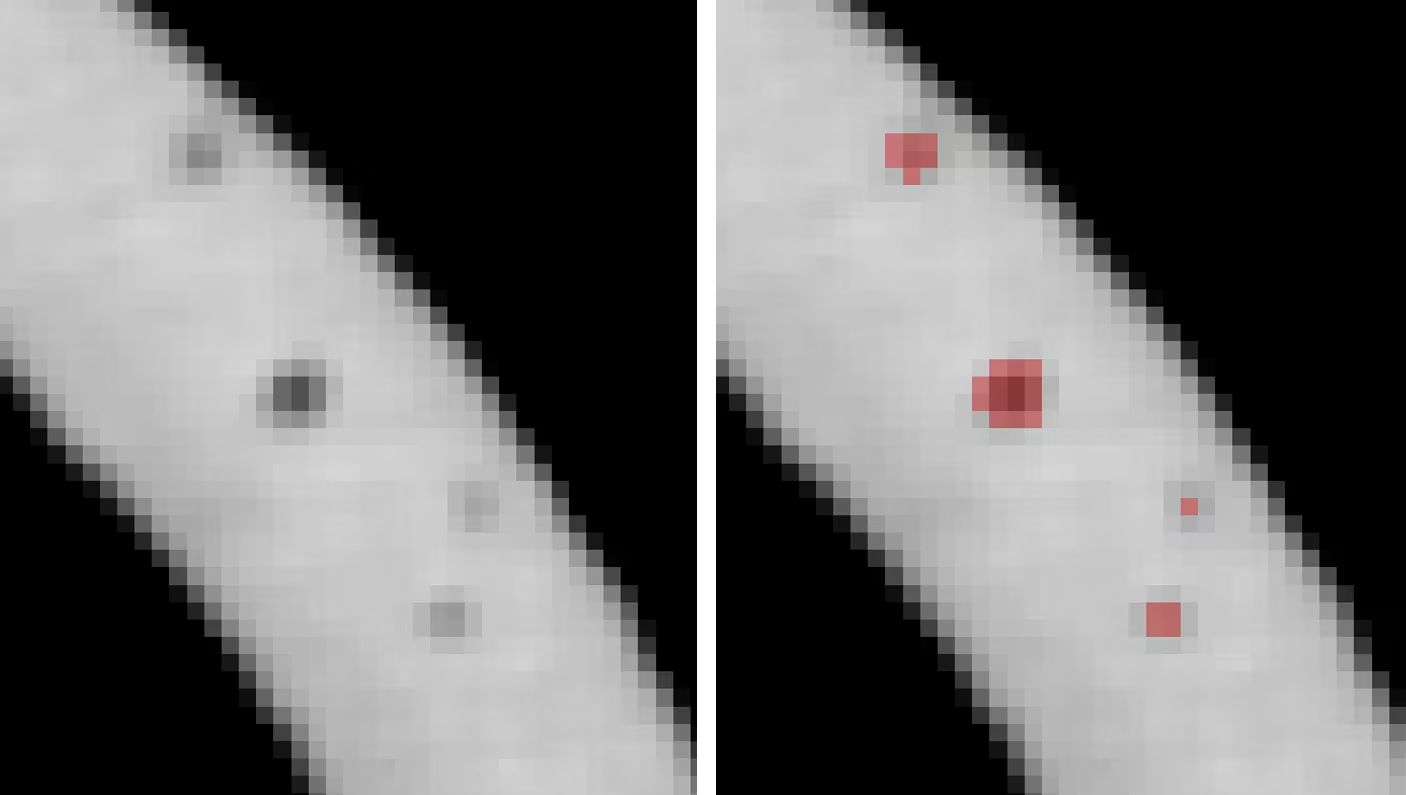
Annotation of the ground truth data
A crucial step in the deep learning process is the annotation of the ground truth data. This involves carefully labeling porosities in the training images, as illustrated in the image: on the left, the original scan; on the right, the same image with pores highlighted in red. It is essential that this labeling is done with great precision—even the inclusion or exclusion of a single voxel can make a difference. The more accurately these annotations are performed, the better the model will learn to distinguish true porosities from noise or other structures. This step forms the foundation of the “truth” the model trains itself on, and is therefore rightly considered one of the most critical factors for achieving high final accuracy.
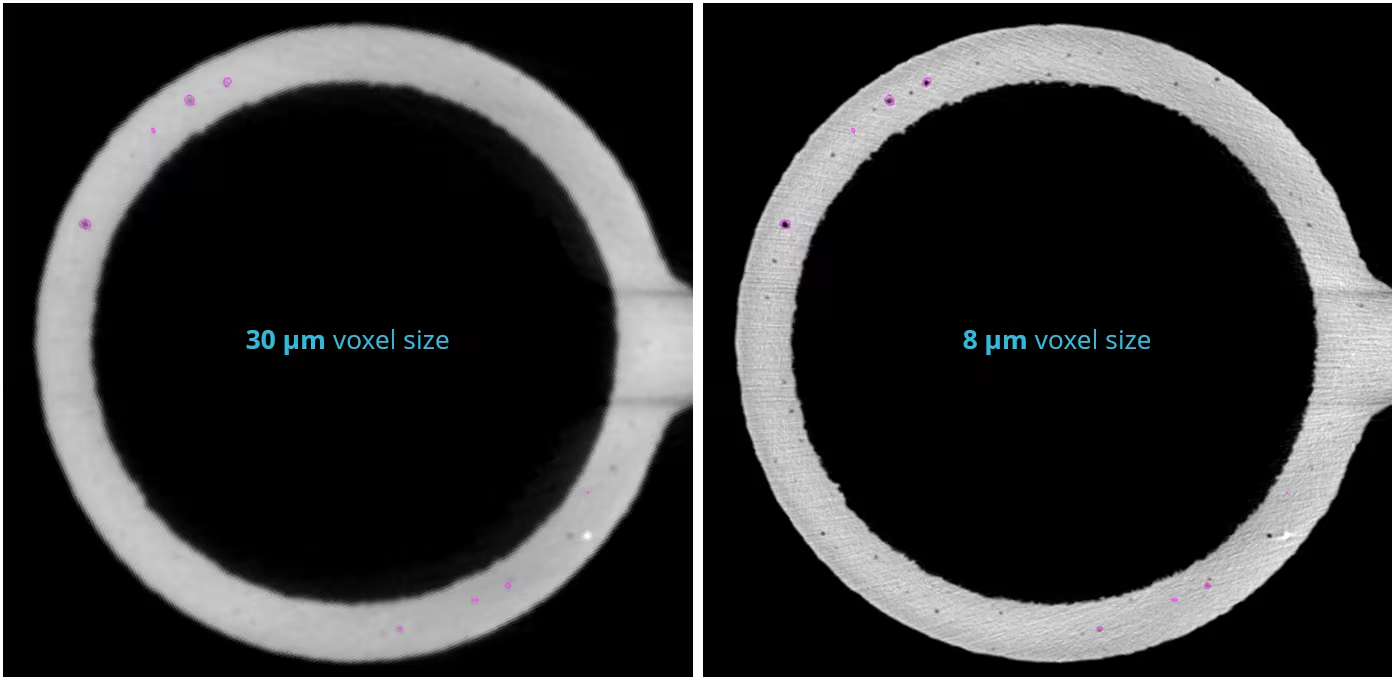
Result of the automatic detection
Below is the result of automatic porosity detection performed on a CT scan with a voxel resolution of 30 µm. To verify the accuracy of this detection, the result was overlaid onto a higher-resolution scan with a voxel size of 8 µm. This comparison shows that the model is capable of correctly identifying most porosities; however, some smaller pores — which are visible in the higher-resolution scan — remain undetected. This is a logical consequence of the limited resolution of the original dataset on which the model was trained.
It is also noticeable that the model does not detect inclusions. This can be explained by the fact that it was exclusively trained on porosities. In principle, inclusions can also be incorporated into the detection process, provided that sufficient representative training data is available in which these anomalies are accurately annotated.
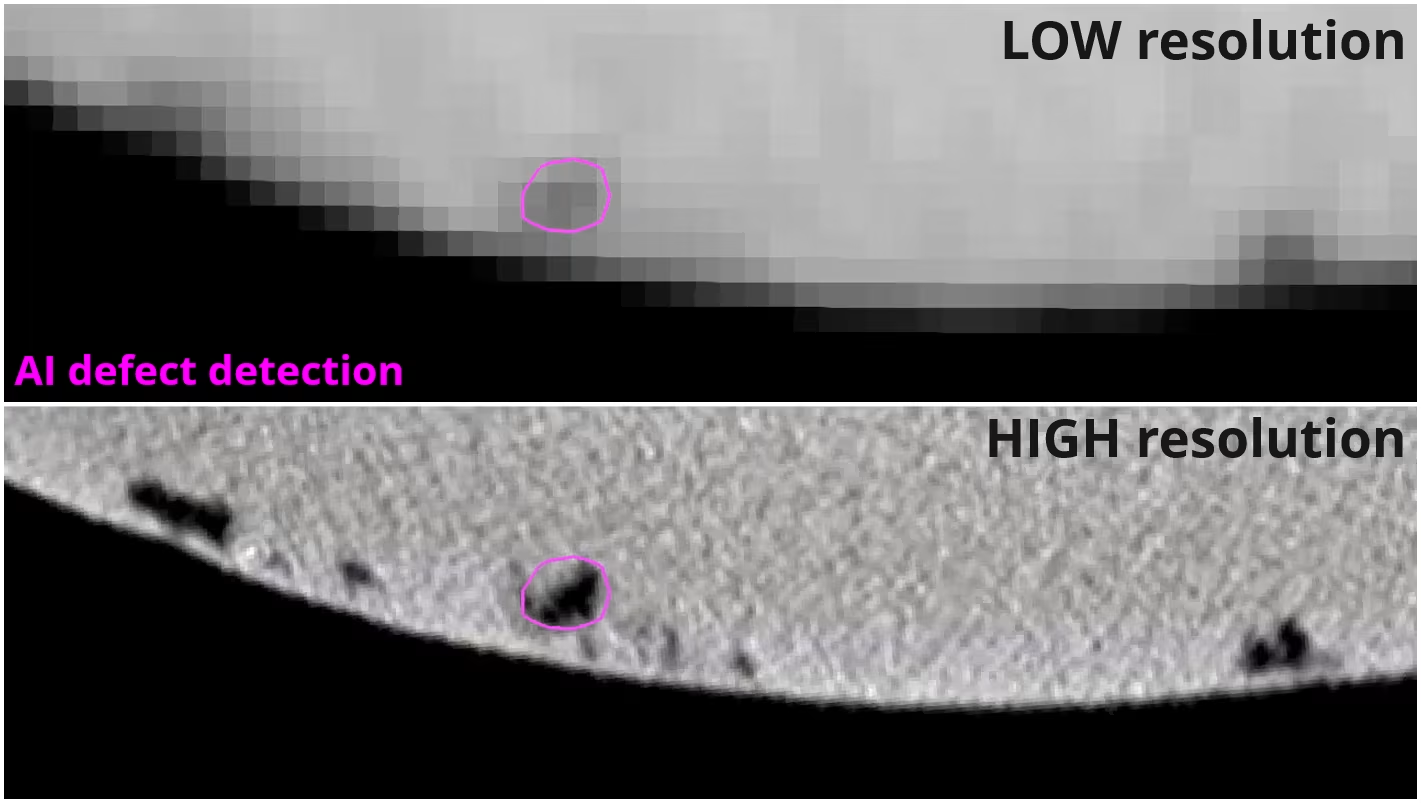
When zooming in on the edge of the component, we observe that porosities located at some distance from the edge are detected well, but small defects close to the boundary are often missed. They disappear into the gradient zone of the edge, where the contrast fades. In the high-resolution scan (4 µm voxel size), the defect becomes clearly visible, highlighting just how important resolution is when inspecting edge regions.